
World’s
Best Workforce Plan
The 2014-2015
World’s Best Workforce Plan was approved by the District 2884 School Board in
the fall of 2014. It is discussed and
approved by the District Advisory Committee to inform residents about
developments in curriculum, instructional practices, test data, SMART GOALS,
and student learning throughout the district.
Red Rock Central Public School District #2884
Superintendent-Bruce Olson
District
Advisory Committee
Bruce Olson: Superintendent
Ron Kelsey: RRC Board Member
Phil Goetstouwers: 5-12 Building Principal
Deb Altermatt: K-4 Building Lead Teacher and
ECSE teacher
Leonard Runck: Technology Coordinator/Parent
Kathy Wacker: Preschool Teacher/Parent
Curt Determan: RRC Parent
Angela Holman: RRC Parent
Lisa Broughton: RRC Parent
Craig Myers: RRC Parent
Brett Baumann: RRC Parent
Megan Imker: RRC Parent
District Advisory Committee met and approved plan on 10/1/2014
Mission
& Vision
“Red Rock Central’s mission and vision is to offer
high-quality education in a dynamic, supportive learning environment and help
all learners develop the knowledge, skills & attitude necessary to lead
healthy, productive, fulfilling & socially responsible lives in a diverse
and changing world.”
Overview
US
News & World Report has
ranked Red Rock Central Secondary 25th and 35th within
Minnesota in the last two years!
The
U of M Humphrey Institute recognized RRC as “1 of 10 Best Prepared High Schools for
College in rural MN”!
Standard
and Poor’s rated
the elementary as a “Top Performing School in MN”!
MinnCan rated
RRC in Minnesota’s top 10 Best Schools!
Only
Digital
Fabrication Laboratory (FABLAB) in
SW MN and smallest school in US to have one!
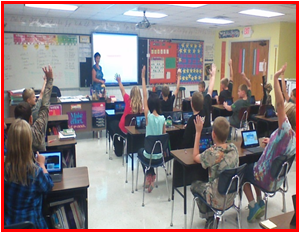
1 to 1 iniative: iPads K-2 and Microsoft Surface
Tablets in preK and grades 3-12!
We
offer concurrent enrollment, which means students have the opportunity to take college
level classes for college credit. We
also offer Advanced Placement® course work and exams as well. The AP®
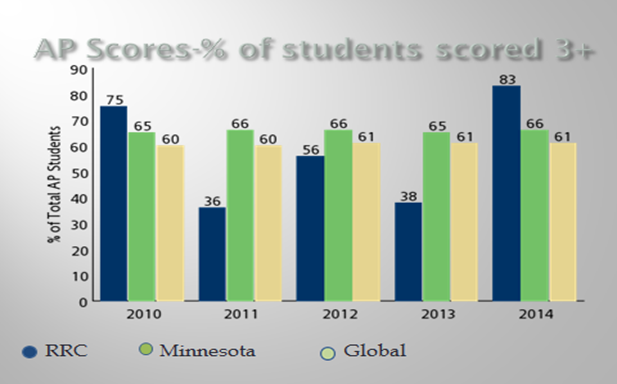
participation rate at Red Rock Central Secondary is 47 percent. Last year, 83% of our students taking the AP
exam received a 3 or higher. The student
body makeup is 54 percent male and 46 percent female, and the total minority
enrollment is 8 percent. Red Rock Central Secondary is the only high school in
the Red Rock Central School District.
Red Rock Central Elementary K-4
107
East Clark Street
Jeffers,
MN 56145
Lead
Teacher-Deb Altermatt alterdeb@rrcnet.org
·
Academic Programs: Accelerated Reader, Love to Read Month, Dental
Health Awareness, Nutrition Education Program, Fire Prevention Week, Read
Naturally
·
Small class sizes with
individual attention
·
Approximately 15 students per teacher
ratio
·
Each student Pre-K thru 4 has their own Microsoft Surface tablet or Mini iPad
·
Activities: 4-6 basketball, K-6 youth wrestling, Plum
Creek Soccer League, 4-6 youth football, Student Council
·
3 yearly Lyceums focusing on
childhood issues and character development
·
Integration days with neighboring
schools
 Red
Rock Central Middle School and High School 5-12
Red
Rock Central Middle School and High School 5-12
100 6th Avenue East
Lamberton, MN 56152
Principal-
Phil Goetstouwers goet@rrcnet.org
·
College Credits: Composition (7),
College Algebra (3), AP Geography & AP Statistics (3-4), College
Literature(3), Auto shop (3)
·
Online JMC System for grades, schedules, lunch accounts, and
attendance
·
Each student grades 5-12 has their own Microsoft
Surface tablet
·
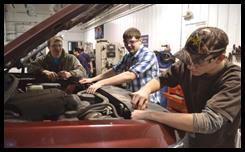
Occupational training courses: Digital Fabrication Laboratory, Automotive,
Cisco Networking, AutoCAD, Occupational Training, RRCNET, Welding, Woodshop,
Graphic Design
·
Sports: Football, Volleyball, Boys & Girls
Basketball, Wrestling, Baseball, Softball, Gymnastics, Boys & Girls Golf,
Track
·
Organizations: National Honor Society, FCCLA, FFA, Annual
Staff, Student Council, Knowledge bowl
·
Fine Arts: Band,
Choir, Fall Musical, One Act Play, Spring Play
|
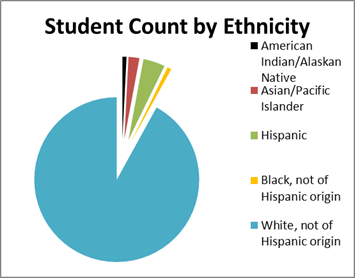
Ethnicity |
Count |
Percent |
|
American Indian/Alaskan Native |
3 |
0.80% |
|
Asian/Pacific Islander |
8 |
2.10% |
|
Hispanic |
16 |
4.30% |
|
Black, not of Hispanic origin |
3 |
0.80% |
|
White, not of Hispanic origin |
344 |
92.00% |
|
All Students |
374 |
100% |

DISTRICT GOALS
Goal 1: All Students Ready for Kindergarten
Goal 2: All Students in Third Grade
Achieving Grade-Level Literacy
Goal 3: Closing Achievement Gap
Goal 4: All Students Career and College
Ready by Graduation
Goal 5: All Students Graduate
Goal 1: All Students Ready for Kindergarten
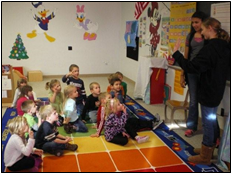
Discovery Garden Preschool
Families in
our district are provided an opportunity to participate in the “Discovery
Gardens” preschool program in both the Lamberton and Jeffers locations. The
district also offers Early Childhood Special Education Services.
Our goal is to have 100% of our
students have the necessary skills to enter kindergarten in the following school
year. To accomplish this, our Discovery Gardens preschool program, our ECFE
program, and our School Readiness program provide the needed services to
prepare our students for kindergarten.
·
RRC offers a
preschool class for children who are 3-4 years old
o
Consists of 4-5
hours per week
·
We also offer a
pre-k class for children who are 4-5 years old
o
These classes are
full school days, twice a week at each building
We implement
effective pre-school screenings and provide necessary support services to
families (ECSE) or interventions for families to achieve school readiness.
We use
Desired Results Developmental Profile access
(DRDP access) Rating Record in
addition to our own progress assessments throughout the school year to ensure
school readiness.
We also use the Minnesota Early Childhood Indicators of Progress, which is intertwined into the daily lessons and hand on experiences provided within the classroom.
In addition, we used reverse
mainstreaming one day per week in ECSE during the last couple of months of last
school year as a review of the skills necessary to be kindergarten ready for a
particular student. Reverse
mainstreaming will be an option for students who are not on pace to be
kindergarten ready.
A progress report is used to
maintain and collect specific data related to kindergarten readiness. This data
is collected in the fall upon
entrance and again in spring prior to exit.
After the collection process
is complete at the end of the year, a collaborative approach is used to
determine the school readiness for each potential kindergarten student.
All students are eligible
to advance to kindergarten, but we use two main criteria to determine if they
are kindergarten ready:
1.
Academically: (i.e., screenings, assessments and work
samples)
2.
Maturity
(i.e., working in groups and fine motor skills)
Results at the end of
2013-2014 school year:
·
In Jeffers, 8 out of 10 students were assessed as kindergarten
ready at RRC under both criteria.
o 1 retained
o 1 started
kindergarten in another district
·
In Lamberton, 11 out of 14 students were assessed as
kindergarten ready under both criteria.
o 2 retained
o 1 moved
·
Three out of nine ECSE students were assessed as
kindergarten ready under both criteria.
o Three were
ready for kindergarten
o Three were
retained
o Three moved
or went to a different district
Goal 2: All
Students in Third Grade Achieving Grade-Level Literacy
It is our goal is to ensure ALL students will achieve grade
level proficiency and read well by grade 3.
Red Rock
Central’s School Literacy Plan
Literacy Plan Summary:
LITERACY PLAN GRADES K-2
Our district is currently using Superkids, a comprehensive core
reading and language arts program, to teach reading in Kindergarten through
grade 2.
·
The program is based on scientific research that validates that
phonics-based instruction is the best way to teach children to read.
·
The goal of the Superkids Reading Program is to produce skillful,
confident readers and writers.
o
Each level of the program provides the systematic phonics-based
reading instruction that children need and the engaging fiction and nonfiction
reading material they love.
o
Reading is taught with spelling and writing so children can
express their own ideas in stories, reports, letters, and more. Included in this program are components
for guided reading, read aloud, shared reading and independent reading.
o
Each classroom has purchased the Superkids Reading library for
their grade level.
LITERACY PLAN GRADES 3-6
Our district will be using the reading series Reading Wonders to
teach grades 3-6. Reading Wonders is a
basal reading program.
·
Included in this program are components for guided reading, read
aloud, shared reading, leveled reading and independent reading.
·
To enhance this curriculum, our district has an elementary library
with a variety of fiction and nonfiction reading materials, covering a wide
range of reading levels.
·
Each classroom also has their own reading center where students can
enjoy books and other resources selected by their teacher.
·
All K-3 students receive classroom reading instruction for a
minimum of 90 minutes each day.
The district uses Accelerated Reader (AR), which is a computerized
program that tests basic reading comprehension.
Students select books from their reading level, read independently and
take an independent comprehension test on the computer. Each book is worth a certain number of points
based on its length and reading level.
All students in grades K-3 are given the Measures of Academic
Progress (MAP) screening/benchmarking assessment three times throughout the
course of the year in fall, winter, and spring.
Using this data along with data from FAST, Standardized Test for the
Assessment of Reading (STAR), local checklists and teacher observations,
struggling and at-risk students are identified and referred for interventions. Specific interventions are based on further
assessments, and the interventions are implemented through the collaborative
efforts of the classroom teacher and other specialists. Progress is monitored
regularly and if the intervention selected is not working, another intervention
is selected and implemented. Students
not responding to these interventions are referred for special education
services. Parents are kept informed of
their child’s progress.
The goal of the Red Rock Central district is to ensure that all
learners successfully achieve the Minnesota K-12 Academic Standards in English
Language Arts (2010) for their grade level.
The standards are aligned with the district’s curriculum to ensure that
the standards are taught within the time available.
Specific information is included in the K-3 Literacy Plan that
follows this summary. For those who are
interested in learning more about Red Rock Central’s literacy program, please
contact: Mr. Olson at 752-7361 or olsonb@rrcnet.org.
Literacy
Plan Goals and Objectives:
Overarching
Goal: All
students will read at grade-level by Grade 3 as determined by the Reading
Minnesota Comprehensive Assessments (MCA-IIIs) by the end of the 2014-2015
school year.
Objectives:
Each year
educators will review and disaggregate, or separate, reading data at grade
levels K, 1, 2, & 3. Proficiency,
growth and trend data will be analyzed and used to set specific learning
targets for each child and for each grade level of students. Pre-K data will be accessed and utilized,
when available.
The
Q-Comp Professional Learning Communities review, annually, the effectiveness of
current instructional practices including core instruction, differentiation,
remediation and intervention.
Curriculum
resources will be aligned to the most current standards.
Formative
assessments will be used to modify instruction and to identify students who are
not on pace to meet proficiency.
Students not on track will follow the local intervention plan.
Professional
Learning Communities will analyze the effectiveness of current literacy
practices. Special attention will be
paid to closing the achievement gaps.
Best practices will be shared.
Process
of Assessment:
The Title
1 Teacher will administer the screening and diagnostic assessments listed
below.
Measures
of Academic Progress (MAP) and MAP for Primary Grades are used as benchmark
assessments. They are adaptive and
sequential tests used to measure student growth. The 2011 NWEA RIT Scale Norms provide growth
and status norms in the following content areas: Reading, Language Usage,
Mathematics, General Science, and Science Concepts and Processes. The RIT
scores for each grade level in Reading and Language Usage are listed in the
following charts:
|
2011 Reading Status Norms (RIT
Values) |
|||
|
Grade |
Beginning-of-Year Mean |
Middle-of-Year Mean |
End-of-Year Mean |
|
K |
142.5 |
151.0 |
157.7 |
|
1 |
160.3 |
170.7 |
176.9 |
|
2 |
175.9 |
183.6 |
189.6 |
|
3 |
189.9 |
194.6 |
199.2 |
|
2011 Language Usage Status Norms
(RIT Values) |
|||
|
Grade |
Beginning-of-Year Mean |
Middle-of-Year Mean |
End-of-Year Mean |
|
2 |
175.4 |
185.3 |
190.0 |
|
3 |
191.1 |
196.5 |
200.3 |
![]()
Formative
Assessment System for Teachers (FAST) will be used for screening, progress
monitoring, and program evaluation.
Assessments include: CBM Reading (K-2 Oral Reading fluency), early
reading (K-1 Concepts of Print, Onset/Initial Sounds, Letter Sounds, Rhyming,
Phoneme Segmentation and Blending, Sight
Word Fluency, Decodable Word Reading, Decodable Nonsense Word Reading
and Sentence Reading) Adaptive Reading (aReading) is a Common Core Standards-aligned,
computer-administered adaptive measure of broad reading individualized for each
student (concepts of print, phonemic awareness, phonics, comprehension, and
vocabulary.
Standards are in bold. That level of performance indicates that students are likely to be
on track
Students below those standards are less likely to be on track.
![]() High risk indicators are in
parentheses. Students at or below those levels
are unlikely to be on track.
High risk indicators are in
parentheses. Students at or below those levels
are unlikely to be on track.
|
|
Benchmarks for CBMReading English
Words Read Correct per Minute |
||
|
Grade |
Fall
|
Winter
|
Spring
|
|
1st |
18 (10) |
43 (27) |
68 (42) |
|
2nd |
55 (18) |
83 (47) |
96 (63) |
|
3rd |
87 (53) |
115 (75) |
129 (93) |
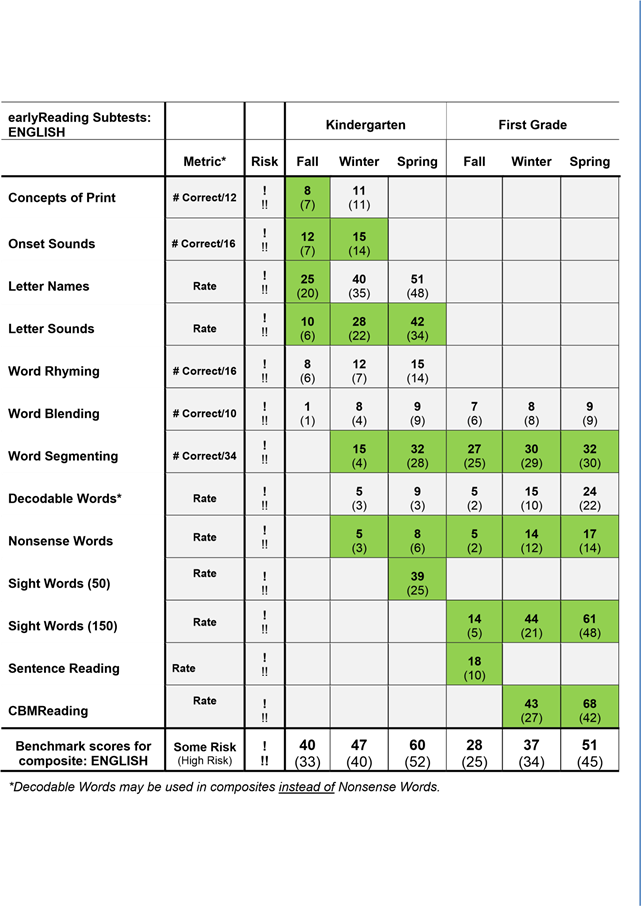
Early Reading Benchmarks
Standards are in bold. That level of performance indicates that students are likely to be
on track to successfully develop early Reading skills.
Students below those standards are less likely to be on track.
High
risk indicators are in parentheses.
Students with scores below
the parenthetical scores are unlikely to be on track to develop early reading
skills.
|
|
Benchmark
Standards for Adaptive Reading |
||
|
Grade |
Fall
|
Winter
|
Spring
|
|
K
|
393
(376) |
415
(398) |
418
(399) |
|
1st |
428
(408) |
451
(433) |
458
(440) |
|
2nd |
462
(443) |
479
(465) |
480
(463) |
|
3rd |
481
(463) |
489
(468) |
489
(471) |
The scaled score
tells the teacher the skills that a student has mastered and the skills that
the student is developing.
Students who do not meet the target score as listed above will be
referred to Title I to work on specific skill deficit(s) using research-based
assessments. Entrance criteria are based on a triangulation of assessment data
with classroom teacher input.
Based on these diagnostic assessments, Measures of Academic
Progress (MAP), FAST, and Standardized Test for the Assessment of Reading
(STAR), instruction and interventions will be matched to the student’s needs in
one or more of the five pillars of reading (phonemic awareness, phonics,
fluency, vocabulary, and comprehension). Progress monitoring data will be
collected and analyzed on a continuing basis.
Parent Communication
and Involvement:
The district will share the state-identified grade-level standards
and how their child is progressing toward meeting these standards at
conferences. Information shared will
include the core literacy instructional practices and the intervention supports
that are used with students who are not on track to achieve benchmark targets
that reflect grade-level content standards.
Parents will continue to be
informed of their child’s progress through quarterly report cards. A list of potential supports that the parents
can use to assist the child in achieving grade-level proficiency will be
provided to the parent.
Red Rock Central encourages parents to be involved in the literacy
development for children PreK-3. The opportunities we provide for parents
include:
·
Screening benchmark
assessment data shared at conferences
·
Title I parent compact
agreement
·
Title I parent
night/advisory meetings
·
Title I newsletter
·
Parent/classroom
newsletters
·
Home School Connect for
Accelerated Reader (AR)
·
I Love to Read month
activities
·
School websites
·
Preschool/Kindergarten
family and school collaboration
·
Early Childhood Family
Education (ECFE)
·
Head Start
Parent Resources:
The following are resources and tools for parents, caregivers,
and/or community members to use in support of literacy practices at home:
www.spellingcity.com- Spelling, Writing, Parts of Speech, Alphabetical Order
www.fcrr.org/FAIR_Search_Tool/FAIR_Search_Tool.aspz
www.softschools.com - games and worksheets
www.abcya.com- games for primary grades K-5
www.funbrain.com- games
www.tutpup.com- compete with kids from all over the world in games
www.apples4theteacher.com- games, quizzes, worksheets, and articles
www.squiglysplayhouse.com- games, brainteasers and much more
www.schoolfamily.com- parent resources and articles
www.internet4classrooms.com- parents resources with great links for students
www.pbskids.org- pbs characters and games to play
www.pbsparetns.org- articles about child development, food and fitness,
education and more
www.https://hosted74.renlearn.com/234508/homeconnect/- AR
www.plumcreeklibrary.org- local library in Lamberton
There are several IPAD apps that are available to parents
also. Parents are able to go to the Red
Rock Central homepage and click on a link that will give IPAD apps for
education. There is also a link for
computer sites.
Based on Best Practices students will receive differing levels of
support. The first level of support
occurs in the classroom with 90 minutes of core instruction delivered by the
classroom teacher using the district’s reading curriculum that is aligned with
the 2010 English Language Arts Standards.
Research-based reading instruction will address the 5 strands of reading
(phonemic awareness, phonics, fluency, vocabulary, and comprehension). Teachers differentiate instruction according
the needs of their diverse learners.
Based on screening and diagnostic assessments, the second level of
support identifies students not meeting grade-level targets who are, then,
provided supplemental reading interventions according to their skill
deficit(s). This level of support will
be provided by Title I.
Students not responding well to the interventions provided at the
second level are referred to Special Education.
Scientifically-Based
Reading Instruction:
The scientifically-based reading curriculum Red Rock Central
Elementary uses is Superkids (K-2) and Reading Wonders (3-6) which is fully
aligned for Common Core State standards and the Minnesota Academic Standards in
English Language Arts (2010).
Instruction is differentiated.
Professional Development:
Red Rock Central Professional Development is provided through:
- Grade-Level Common Planning Time
- Professional Learning Communities (PLCs)
At the beginning of the school year data will be disaggregated and
analyzed in PLCs that will then create SMART student goals and plan
Professional Development activities designed to address the needs identified by
the data. PLCs will provide regular
opportunities to improve reading instruction in the five reading areas
(phonemic awareness, phonics, fluency, vocabulary, and comprehension).
Goal 3:
Closing Achievement Gap
DISTRICT SPECIFIC ACHIEVEMENT AND INTEGRATION
GOAL:
1) Reduce Achievement Gap
DISTRICT SMART GOALS:
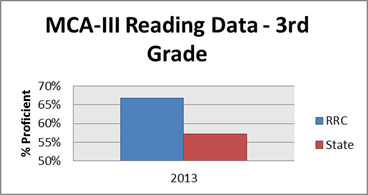
1) The percentage of students who are
proficient in reading will increase from 66.2% in 2013 to 83.1% for all
students in 2017.
DISTRICT STRATEGIES FOR ACCOMPLISHING GOALS:
Reduce Achievement Gap
A)
RESEARCH BASED INTERVENTIONS: Provide a reading intervention based
program to be conducted throughout the school year by a fully licensed teacher
who specializes in reading strategies and interventions. This small group intervention program will
serve students who are struggling to understand reading concepts and will
utilize research based response to intervention strategies supported by the
“Reading Wonders” curriculum. The Reading Wonders curriculum is based on Common
Core State Standards These interventions will utilize the “Wonder Works”
Intervention strategies contained in this series. Targeted classes will be K
through 6th grade.
B)
RESEARCH BASED INTERVENTIONS: Utilization of learnpad and Surface tablets
to enhance classroom instruction, through the use of small group/individual
integrated applications, in order to provide additional individualized learning
opportunities for students. Integrated
technology that utilizes research driven content such as reading eggs, study
island, or curriculum enhancements (in our school reading program) have
produced positive results according to the 2012 John Hopkins research “Effects of Educational
Technology Applications on Reading Outcomes for Struggling Readers.”
EVALUATION PLAN:
A)
Proficiency growth on MCA’s will be kept for all students
participating in the Red Rock Central School District. Tracking comparisons for
Non Free and Reduced and Free and Reduced will be compared on a yearly basis to
determine the effectiveness of our interventions
B) FAST (Formative Assessment System for
Teachers) benchmark data will be collected at the beginning of the year with
growth benchmarking completed at the end of each quarter.
C) Longitudinal FAST growth data will be
analyzed for all groups utilizing Learnpads
and Surface tablets to determine strategy effectiveness.
INDICATORS OF SUCCESS:
|
Proficiency Increases in Reading |
|||||
|
Student
Group |
Baseline 2013 |
2015 Target |
2016 Target |
2017 Target |
Increase
Target |
|
All
Students |
66.2% |
71.8% |
77.4% |
83.1% |
16.9% |
|
FRP
Students |
57.8 |
64.8% |
71.8% |
78.8% |
21.1% |
|
Non FRP
Students |
72.1% |
76.7% |
81.3% |
85.9% |
13.9% |
|
Gap Decrease in Reading Proficiency |
|||||
|
Student
Group |
Baseline 2013 |
2015 Target |
2016 Target |
2017 Target |
Decrease Target |
|
Achievement
Gap |
8.4% |
7% |
5.54% |
4.3% |
4.2% |
|
FRP
Students |
57.8% |
64.8% |
71.8% |
78.8% |
21.1% |
|
Non FRP
Students |
72.1% |
76.7% |
81.3% |
85.9% |
13.9% |
SUMMARY OF COLLABORATIVE GOALS:
1) Increase Racial and Economic Integration
among Students
2) Increase College and Career Readiness of
Underrepresented Students
COLLABORATIVE SMART GOALS:
1) 50% of Southwest Integration
Collaborative students taking the ACT exam will participate in inter-district
ACT preparation courses as measured
by course attendance and ACT exam rosters during the 2016-2017 school year.
2) Southwest Integration Collaborative
students participating in the ACT prep course will
increase the district average ACT
composite score by 1 point over 2012-2013 scores
with underrepresented sub groups attaining the same average increase by the end of the three year plan cycle.
STRATEGIES FOR ACCOMPLISHING GOALS:
Increase racial and economic integration
among students
1) COLLEGE
CAREER READINESS FOR UNDERSERVED STUDENTS:
Two inter-district ACT preparation courses per year will held at Marshall
High School in the areas of Math, English, Math, Reading, and Science for all
collaborative students intending on taking the ACT exam.
2) RESEARCH
BASED INTERVENTIONS: Environmental Science Camp – Environmental Science Camp
will be offered for three days in April. The fifth graders of our Collaborative
have the opportunity to travel to northern Minnesota where they stay together
stay at a camp facility on Lake Carlos.
This camp brings students from many cultures together and engages them
in hands on learning. Environmental
Science camp has structured, objective based lessons that align with Minnesota
standards (see submitted handout). Transportation and all camp costs are provided
to all students. Staff and parents are
involved in the programming and supervision during this camp. This strategy fulfills the requirement to
receive incentive revenue.
Increase college and career readiness of
underrepresented students
1) COLLEGE
CAREER READINESS FOR UNDERSERVED STUDENTS Two inter-district ACT preparation
courses per year will held at Marshall High School in the areas of Math,
English, Math, Reading, and Science for all collaborative students intending on
taking the ACT exam.
2) COLLEGE CAREER READINESS FOR UNDERSERVED
STUDENTS: To increase awareness and encourage participation, Southwest
Integration Collaborative schools will show the MDE Dual Enrollment video to
all 10th and 11th grade students’ prior registration each
year of the plan cycle.
EVALUATION PLAN:
1) Each member district will establish
baseline data and annually track participation as well as effect on ACT scores.
2) Each member district will maintain
desegregated data to determine the impact of the prep coursework amongst participating and non-participating
students.
3) Each member district will maintain
participation data that will track the number of underrepresented students participating in prep coursework as well as the number of underrepresented student taking
that ACT.
4) Each member will maintain longitudinal
ACT result data that will be annually reported to the Collaborative Coordinator.
INDICATORS OF SUCCESS:
1) Annual increase in the percentage of
students participating in ACT preparation courses.
2) Annual progression increase towards the
goal of 50% of collaborative student taking the ACT exam participating in inter-district ACT prep courses.
3) Annual progression towards achieving an
increase of district average ACT composite scores by 1 point over 2012-2013 scores with underrepresented sub groups attaining the same average
increase by the end of the three year plan cycle.
4) Annual increase, throughout the plan
cycle, of enrollment in college preparation courses within individual district
high schools.
Creating Efficiencies and Eliminating
Duplicative Programs:
Members of
the Southwest Integration Collaborative share in the responsibility of the
costs to operate the inter district integration and achievement collaborative
as approved by the joint powers committee.
Each member district receives 100% of integration and achievement
funding and remits payment to the Collaborative Fiscal Host (Westbrook-Walnut
Grove) for invoiced expenses incurred by the collaborative. Collaborative expenses are determined based
upon student count ratios.
The
strategies identified in the collaborative plan have created efficiencies
amongst collaborative member by creating one central opportunity for all
schools to attend in order to prepare their students for the ACT, eliminated
the need for individual schools to pay for separate instructors and materials,
and allows for the use of experiences and highly qualified staff throughout the
districts to provide the highest quality experience possible for students.
Community Input:
The
collaborative plan is developed by the multi-district planning committee and is
reflective of individual district’s integration and achievement goals. Each district of the Southwest Collaborative,
as part of their community reporting and feedback meetings, will provide the
collaborative plan and assessment results to their communities in order to
provide transparency of process, information, and also to seek further input
for future plans and budgets.
Goal 4: All Students Career and College Ready by
Graduation
It is our goal to have all students be career and
college ready by the time they graduate.
We will accomplish this goal by means of:
·
Implementation of effective strategies listed under previous goals
·
Use local and state standards on assessments to determine proficiency
and career and college readiness
o NWEA (elementary)
o MCAs (grades 3-11)
o OLPA (grades 5-6)
o NAEP (4th & 8th
grade) District occasionally chosen
o EXPLORE (8th graders)
o PLAN (10th
graders)
o COMPASS (10th
graders)
o ACT (11th
graders)
·
Offer classes for college credit
o Concurrent Enrollment
classes
o Advance Placement classes
o Articulated Agreement
classes
·
Q-comp
·
Multiple Measurement Ratings
·
Principal Evaluation
·
Teacher Evaluation
ASSESSMENTS
Red Rock Central is consistently near the top performing
schools in ALL assessments in SW Minnesota!!!
Our goal remains to perform higher than the mean score for
the state in all categories.
·
NWEA in grades K-4
·
MCA (meets federal requirements) Grades 3-11
·
OLPA (5th-6th grade)-version of MCAs
o Replaces NWEA in Lamberton
building
o Reading once/year
o Math could do twice/year
·
EXPLORE-All 8th grade
·
PLAN-All 10th grade
·
PSAT
·
ACT-All 11th grade (meets state requirements)
·
COMPASS (meets state requirements)
o MDE identifies 10th
graders not college ready by end of December
o COMPASS test (computerized)
o Students will need to take
any or all sections not college ready
·
Advanced Placement Exams
ASSESSMENTS RESULTS
|
Percentage of Students Meets or
Exceeds on MCA’s |
|||
|
2013-2014 |
|||
|
Grade |
Reading |
Math |
Science |
|
Grade 3 |
79% |
90% |
N/A |
|
Grade 4 |
71% |
87% |
N/A |
|
Grade 5 |
63% |
56% |
59% |
|
Grade 6 |
61% |
59% |
N/A |
|
Grade 7 |
58% |
65% |
N/A |
|
Grade 8 |
67% |
73% |
41% |
|
Grade 10 |
80% |
N/A |
61% |
|
Grade 11 |
N/A |
63% |
N/A |
Red Rock Central School
District 2010-2014 MCA Proficient %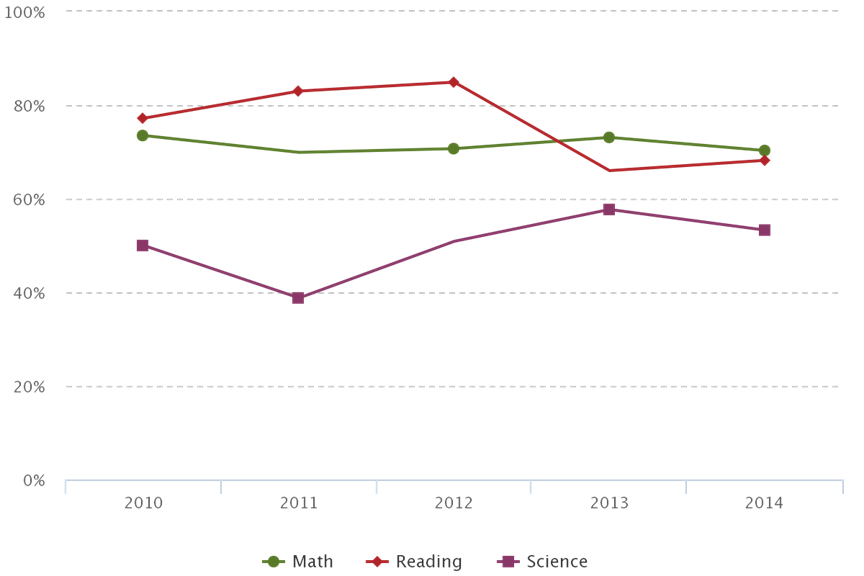
2010-2014 Math Proficiency
We continue to strive to be above the state average by at
least 8% in math proficiency.
|
Statewide |
|||
|
Year |
Percent Proficient |
Number Proficient |
Number Tested |
|
2010 |
64.70% |
275,827 |
426,392 |
|
2011 |
56.00% |
239,183 |
427,399 |
|
2012 |
61.30% |
263,827 |
430,619 |
|
2013 |
60.20% |
261,002 |
433,493 |
|
2014 |
60.50% |
263,921 |
436,130 |
|
Red Rock Central |
|||
|
Year |
Percent Proficient |
Number Proficient |
Number Tested |
|
2010 |
74.00% |
179 |
242 |
|
2011 |
69.90% |
165 |
236 |
|
2012 |
70.90% |
168 |
237 |
|
2013 |
72.40% |
160 |
221 |
|
2014 |
69.90% |
151 |
216 |
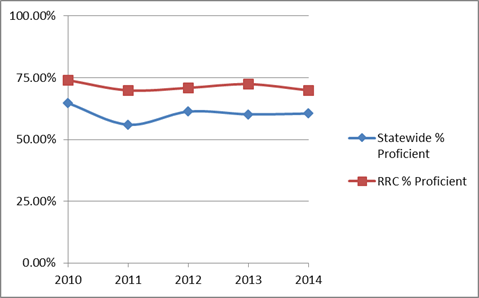
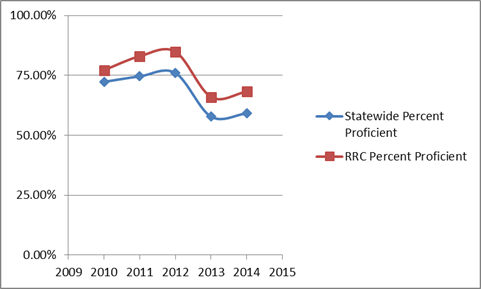
2010-2012 MCA-II Reading Proficiency
& 2013-2014 MCA-III
We continue to strive to be above the state average by at
least 6% in reading proficiency.
|
Statewide |
|||
|
Year |
Percent Proficient |
Number Proficient |
Number Tested |
|
2010 |
72.30% |
303,774 |
419,891 |
|
2011 |
74.60% |
309,917 |
415,561 |
|
2012 |
76.00% |
316,176 |
415,871 |
|
2013 |
57.80% |
242,949 |
420,170 |
|
2014 |
59.10% |
249,670 |
422,779 |
|
Red Rock Central |
|||
|
Year |
Percent Proficient |
Number Proficient |
Number Tested |
|
2010 |
77.20% |
183 |
237 |
|
2011 |
83.00% |
195 |
235 |
|
2012 |
84.90% |
191 |
225 |
|
2013 |
66.00% |
142 |
215 |
|
2014 |
68.20% |
144 |
211 |
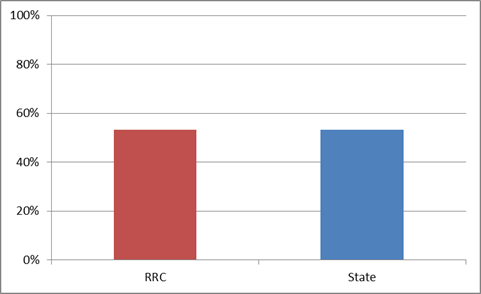
2014
Science MCA-III All Grades vs Statewide
We continue to strive to be above the state average by at
least 1% in science proficiency.
|
Organization |
Percentage Proficient |
Number Tested |
|
STATEWIDE |
53.20% |
178,123 |
|
RED ROCK CENTRAL SCHOOL DISTRICT |
53.30% |
92 |
Composite ACT Scores
We strive to be above the state average by at least 1
composite point in ACT Composite scores in addition to having the highest
composite ACT scores in southwest Minnesota.
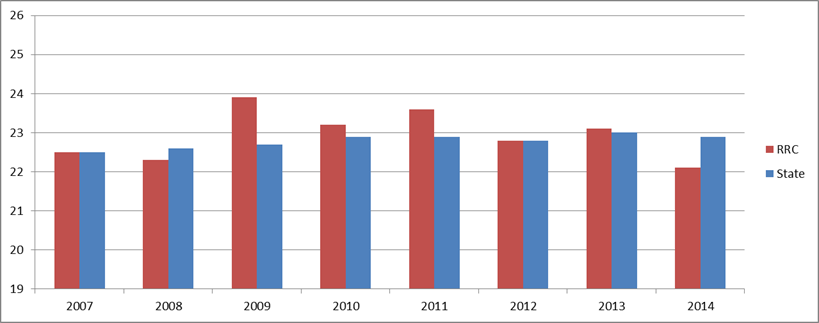
ACT Test Results since 2007
We strive
to be above the state average by at least 1 point in each category of the ACT
scores.
|
Total Tested |
English |
English |
Math |
Math |
Reading |
Reading |
Science |
Science |
Composite |
Composite |
||
|
Grad Year |
RRC |
State |
RRC |
State |
RRC |
State |
RRC |
State |
RRC |
State |
RRC |
State |
|
2007 |
21 |
43534 |
21.5 |
21.8 |
22.6 |
22.5 |
23.1 |
22.8 |
22.1 |
22.5 |
22.5 |
22.5 |
|
2008 |
25 |
44863 |
21.4 |
21.9 |
23.1 |
22.6 |
21.9 |
23 |
22.3 |
22.5 |
22.3 |
22.6 |
|
2009 |
16 |
43642 |
23.8 |
22 |
24.8 |
22.7 |
24.4 |
23.1 |
22.4 |
22.6 |
23.9 |
22.7 |
|
2010 |
23 |
44323 |
22 |
22.3 |
23.3 |
22.9 |
23.6 |
23.2 |
23.2 |
22.8 |
23.2 |
22.9 |
|
2011 |
19 |
44952 |
21.5 |
22.3 |
24.5 |
23 |
24.1 |
22.9 |
23.8 |
22.8 |
23.6 |
22.9 |
|
2012 |
18 |
44977 |
21.2 |
22.1 |
23.7 |
23 |
22.4 |
22.9 |
23.4 |
22.7 |
22.8 |
22.8 |
|
2013 |
16 |
44676 |
22.3 |
22.2 |
23.4 |
23.1 |
24.3 |
23.1 |
22.4 |
22.9 |
23.1 |
23 |
|
2014 |
20 |
45305 |
20.5 |
22.1 |
21.8 |
23 |
22.6 |
23.1 |
22.8 |
22.9 |
22.1 |
22.9 |
AP SCORES:
% of STUDENTS SCORED 3+
AP Statistics was offered every year while AP Geography was only offered
every other year starting in 2011.
We strive to have a higher percentage of students scoring at least a 3 on
their AP Statistics exams compared to the state and nation.
Our goal this year is to increase the overall average score on the AP
Geography exams by at least .08. In
2011, RRC’s mean score for Human Geography was 2.00. In 2013, RRC’s mean score for Human Geography
increased to 2.42.
NATIONAL ASSESSMENT OF EDUCATIONAL PROGRESS (NAEP)
Statewide
Goal to Improve NAEP Achievement
NAEP RESULTS ARE RELEASED BY
STATE. RED ROCK CENTRAL STUDENT NAEP RESULTS AREN’T IDENTIFIABLE.
(NAEP is to
be included in WBWF plan)
Improvement
Strategy-NAEP: The
district believes its strategies for improvement on MCA’s complements NAEP
achievement.
Classes Offered for College Credit at RRC
Our goal is for at least ½ of the graduating class to take a minimum of
one of the classes listed below.
Concurrent Enrollment
·
Composition: Technical Writing (4 college
credits)
·
Composition: Speech (4 college credits)
·
College Algebra (3 college credits)
·
College Literature(3 college credits)
Advanced Placement
·
AP Geography (3-4 college credits)
·
AP Statistics (3-4 college credits)
Articulated
Agreement
·
Automotive
Class (up to 13 college credits) depending on college
o
MN-West
Community and Technical College
o
Ridgewater
Community and Technical College
o
Riverland
Community College
o
Rochester
Community and Technical College
o
South Central
Community and Technical College
·
Potential
credits for:
o
Introduction to
Automotive Technology
o
Basic Engine
Performance
o
Brakes
o
Starting &
Charging Systems
o
Basic
Electrical
Q-Comp
·
A quality compensation program and professional
development for teachers
·
Staff meets weekly in Q-Comp cluster groups also
known as Professional Learning Communities (PLC’s)
·
Teacher Leaders share teaching strategies in cluster
groups
·
Effective, research-based teaching and learning
strategies are shared and implemented across curricula
·
Our goal is to improve student academic achievement
through data-driven decision making and professional development
STEPS TO
IDENTIFY Q-COMP GOALS
In identifying, creating and implementing district and building goals, we
follow these steps:
Step 1: We review existing district goals, including
supporting district and state data as well as the district educational
improvement plan and other plans (e.g., Title I, staff development).
Step 2: We review schoolwide results for all state
accountability tests (MCA, MTAS, MOD) for All
Students in reading, mathematics and science as well as other schoolwide
standardized academic achievement tests.
Step 3: Based on the data review, we determine the
academic content area focus and select a standardized assessment for the
content identified.
Step 4: We select
a measure of achievement defined by the standardized assessment and collect
trend data.
MCA data includes all state
accountability tests (MCA, MTAS, MOD).
We identify
the academic content area assessed:
Reading Mathematics Science Other:
We identify
assessed grades in the SMART goal:
We identify the valid measure of achievement (e.g.,
percent proficient):
We
analyze school trend data for grades assessed and number of students assessed:
(All
percentages must be calculated to at least one
decimal place.)
Step 5: We identify the amount of reasonable increase
within the goal period.
Step 6: We create a schoolwide student academic
achievement SMART goal
In the
2013-2014 school year, our Q-Comp goals included:
Lamberton Building student academic achievement SMART
Q-Comp Goal:
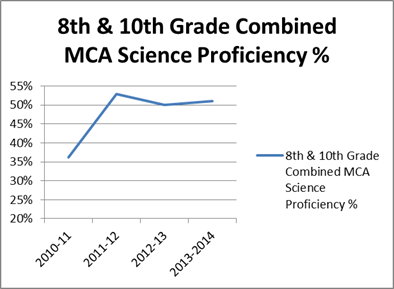
The
percentage of all students enrolled October 1 in grades 8 and 10 at Red Rock
Central School who earn an achievement level of proficiency on the standards on
the Science MCA will increase from 50.0% in 2013 to 52.0% in 2014.
Result: Although we improved 1%, we did not accomplish our
goal.
Combined 8th and 10th Grade MCA
Science Results
|
School year |
Assessment result |
Number of student scores |
|
2010-11 |
36.2% |
69 |
|
2011-12 |
52.8% |
72 |
|
2012-13 |
50.0% |
62 |
|
2013-2014 |
51.0% |
65 |
Jeffers
Building student academic achievement SMART Q-Comp Goal:
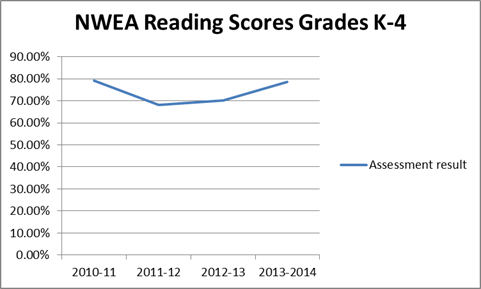
The percentage of all students enrolled October 1 in grades
K-4 at RRC who meet or exceed their fall to spring individual RIT growth
projection on the NWEA MAP in reading will increase from 70.1% in spring 2013
to 72.1% in spring 2014.
Result: We accomplished our goal
and reached 78.5%.
|
School year |
Assessment result |
Number of student scores |
|
2010-11 |
79.1% |
159 |
|
2011-12 |
68.1% |
145 |
|
2012-13 |
70.1% |
128 |
|
2013-2014 |
78.5% |
122 |
NWEA Reading Scores grades K-4
2014-2015 Q-COMP GOALS
Lamberton
Building student academic achievement SMART Q-Comp Goal:
The percentage of all students
enrolled October 1 in grades 8 and 10 at Red Rock Central School who earn an
achievement level of proficiency on the standards on the Science MCA will
increase from 51.0% in 2014 to 52.0% in 2015.
Jeffers
Building student academic achievement SMART Q-Comp Goal:
Students
in grades 2 and 4 will raise their grade mean on the NWEA Science test by 2.0
points from fall 2014 to spring 2015. This will support the Red Rock
Central High School in achieving their Science site goal.
MULTIPLE MEASUREMENT RATING
Red Rock Central elementary
This school is currently designated
as a CELEBRATION ELIGIBLE school!
Celebration Eligible Schools are in
the 60th to 85th percentile of top performing schools based on their Multiple
Measurement Rating. RRC elementary MMR percentile is 73.01%, which means
RRC elementary is ranked in roughly the top ¼ of the state for these four
categories!
Multiple Measurement Domain Summary
|
Domains |
Year |
Number of students |
Measurement |
Score |
Points |
|
Proficiency |
2013 |
56 |
Weighted Percent of Cells
Reaching Target |
100.00% |
25 |
|
2014 |
57 |
Weighted Percent of Cells
Reaching Target |
100.00% |
25 |
|
|
Growth |
2013 |
26 |
Average Growth Z Score |
-0.1537 |
9.51 |
|
2014 |
29 |
Average Growth Z Score |
0.0614 |
13.5 |
|
|
Achievement Gap Reduction |
2013 |
8 |
Achievement Gap Score |
0.5402 |
- |
|
2014 |
17 |
Achievement Gap Score |
0.0099 |
- |
Red Rock Central Secondary
Multiple Measurement Domain Summary
RRC secondary MMR percentile is 77.58%, which means RRC secondary is ranked in the top ¼ of
the state for these four categories!
|
Domains |
Year |
Number of Students |
Measurement |
Score |
Points |
|
|
2013 |
162 |
Weighted Percent of Cells
Reaching Target |
100.00% |
25 |
||
|
|
2014 |
153 |
Weighted Percent of Cells
Reaching Target |
100.00% |
25 |
|
|
2013 |
188 |
Average Growth Z Score |
0.1269 |
14.67 |
||
|
|
2014 |
179 |
Average Growth Z Score |
0.0053 |
15.07 |
|
|
2013 |
91 |
Achievement Gap Score |
0.1054 |
13.58 |
||
|
|
2014 |
74 |
Achievement Gap Score |
0.0121 |
17.46 |
|
|
2014 |
39 |
Weighted Percent of Cells
Reaching Target |
100.00% |
25 |
PRINCIPAL EVALUATION
Goal :
Ensure a high
performing workforce by incorporating continuous improvement at all levels of
the organization.
Improvement Objectives:
Implementation of the State Requirements for Principal
Evaluation.
· Aligned with Minnesota K-12 Principal
Competencies
· School as a Learning Community
· Recognize the importance of a
principal’s role in improving the culture of learning and connecting academic,
social, emotional, and developmental growth for all students
· Indicators of student growth will
include standardized test data to meet accountability requirements
· Evaluation Process is to provide
feedback to promote a high level of performance and support their personal and
professional growth
· Support district continuous progress
and connected to our school district improvement goals
· Align building and district goals
with the vision of the school district and community
· Principal
Evaluation occurs Annually
TEACHER
EVALUATION
The goal of RRC’s teacher
evaluation system is to articulate expectations, assess performance in the
instructional domain, and provide support for the development of high
performing teachers capable of delivering outstanding education that improves
the quality of teaching and learning.
Instruction is improved through self-assessment and reflection,
individual and Q-comp cluster group goal setting and peer observations.
According to MN Statute
122A.40, Subd. 8, this is our teacher development and evaluation plan for Red
Rock Central School District #2884, which was jointly agreed on by the local
School Board and teachers union.
1) Probationary teachers will
be evaluated at least three times periodically throughout each school year and
the first evaluation will occur within the first 90 days of teaching service.
2) The annual evaluation
process will consist of a three-year professional review cycle for each
teacher, which includes:
a. Sixty-Five percent of
three-year review includes:
i.
Individual Growth and Development Plan completed at beginning of each
year
ii. Annual peer observations
iii. Annual self-rating regarding
longitudinal data on student engagement utilizing the student survey
iv. One summative evaluation
performed by a qualified and trained evaluator such as a school administrator
b. Thirty-five percent of
three-year review includes:
i.
Annual growth data from assessments that are valid, reliable and
aligned to state and local academic standards and measures of student growth
ii. Teachers will use the
curriculum’s standards in their own field to set their own goal to measure this
35%
3) The evaluations will be
based on professional teaching standards.
4) Red Rock Central’s annual
evaluation process will coordinate staff development activities with this
evaluation process and teachers’ evaluation outcomes.
5) The school district may set
aside time during the school year for teacher collaboration.
6) Mentoring programs may exist
in the district.
7) Teachers will have an option
to develop and present a portfolio demonstrating evidence of reflection and
professional growth, and include teachers’ own performance assessment based on
student work samples and examples of teacher’s work as written in statute, but
parameters will need to be approved by administration.
8) At the beginning of each
year, each teacher will complete their own individual growth and development
plan.
9) Teachers will reflect,
evaluate, and rate oneself annually using Charlotte Danielson’s Component 3C:
Engaging Students in Learning using all four elements listed and utilizing the
student survey.
10) Licensed, qualified and
trained, school administrators will perform summative evaluations.
11) Support will be given to
teachers not meeting professional teaching standards, which includes a teacher
improvement process with established goals and timelines.
12) A teacher will be
disciplined if the individual fails to make adequate progress in the teacher
improvement process under clause (11).
Discipline may include a last chance warning, termination, discharge,
nonrenewal, transfer to a different position, a leave of absence, or other
discipline a school administrator determines is appropriate.
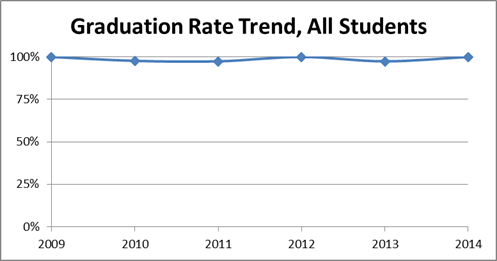
Goal
5: All Students Graduate
Our goal and
expectation at Red Rock Central is and always has been for 100% graduation rate.
We pride
ourselves in providing the resources and support needed for every student to
graduate and settle for nothing less than 100% graduation rate.
When high
school students transfer into our school below credits of on pace graduation,
we assist and work extensively to help them graduate. Sometimes it takes these students an
additional year to graduate and be college and career ready.
|
Graduation Rate Trend, All Students |
||
|
Year |
Graduated % |
Graduated Count |
|
2009 |
100% |
30 |
|
2010 |
98% |
42 |
|
2011 |
97% |
37 |
|
2012 |
100% |
31 |
|
2013 |
97% |
37 |
|
2014 |
100% |
32 |